Global Warming
Ok, so whats the difference between these studies?
Earth hottest it's been in 2,000 years
Earth's temperature at 400-year high - study
THE HEADLINE! And, they are from the same page of the same site! (Yahoo!)
I know that most people don't actually read the reports that come out about many different things. To me, those two headlines should not be able to come from the same study. In one case, we have a hottest temperature since Jesus, in the other, we have the hottest temperature since Galileo Galilei. Seems like a big difference to me. Also, what does the hottest temperature over 2,000 years mean, if 2,000 years is always considered less than a blink of an eye in earth time? Is it the hottest temperature ever? The hottest temperature since the dinosaurs? Where is this hottest temperature? Is it some sort of average? I should read the report it seems. Hopefully, it can answer some of those questions.
So, page 2. Interesting. Using the multiproxy method, two different groups separated by three years estimate different temperatures, sometimes with a difference of 0.3 degrees. It does seem to be inescapable that the trend is sharply turning up. ah ha! Another group using the multiproxy in 2005... They also don't track well. They hit peaks and troughs at approximately the same time. I would love to see the uncertainty on the same plot. I don't know why they don't show it, but just talk about how bad it gets as you go back in time. They do basically say that anything pre-900 is pretty much a guess. The report is guarded against saying that global warming is all us, all pollution. "Not all proxy records indicate that the recent warmth is unprecedented" this is in contrast to Mann et al. 's statement that the "late 20th century warmth in the Northern Hemisphere was unprecedented". It is "plausible that the Northern Hemisphere was warmer during the last few decades of the 20th century than during any comparable period over the preceding millennium". Listen to this quote you won't hear in the news, "Even less confidence can be placed on the original conclusions by Mann et al. (1999) that 'the 1990s are likely the warmest decade, and 1998 the warmest year, in at least a millennium' because the uncertainties inherent in temperature reconstructions for individual years and decades are larger than those for larger time periods, and because not all of the available proxies record temperature information on such short timescales"
In the Overview, they state that we should see 2-6 degrees of increase temperature on average. It looks to me like this is based on a linear-type interpolation of the last part of the "hockey stick". It could be quadratic, but whatever. My point is that if you look at the slope of the tree rings data right before the year 1000, you will see something just as alarming. I am wondering if all of the data is using the same amount of time between points.
The overview is pretty good, I like what it focuses on, and what it tells you about each method. Recommended reading. Found it! Here is a graph with uncertainty.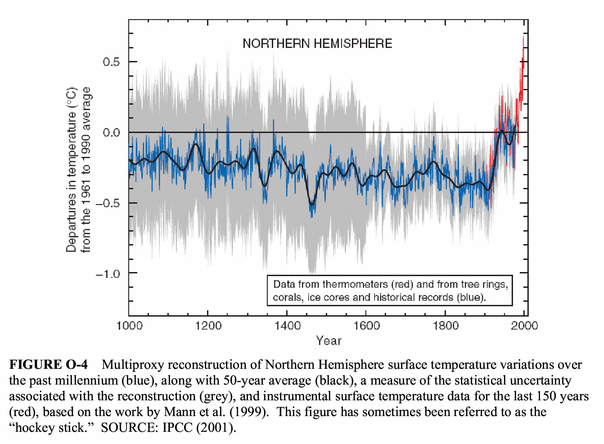 It also says this about those uncertainties "It should also be emphasized that the error bars in this particular figure, and others like it, do not reflect all of the uncertainties inherant in large-scale surface temperature reconstructions based on proxy data". Another interesting point. How big are the uncertainties? Like, the uncertainty in the year 1000 is greater than the amount that we are higher than the 0 degree value. How can we say that its the hottest since year 0, if the uncertainty is larger than the amount that we are believed to be higher by? Also on uncertainties, "Nor is it possible to assign error bars to either individual reconstructions or to the ensemble of reconstructions that reflect all of the uncertainties inherent in the conversion of proxy data into large-scale surface temperature estimates." God I wish they released this in a cut and paste - able format.
Good graphs on page 18. Even will all of the uncertainties, it still looks like there is warming happening. I am not going to read the technical chapters. It was illuminating to read the overview, but most readers won't read about how they know that they are not sure. I am not casting doubt on the conclusions that they have made, but wanted to make sure that the conclusions were based on valid data. Garbage data in, garbage conclusions out. With a bit or massaging, you could seem to call this either way. The thing that points to global warming is that in the other cases of peaks, like around year 1000, or troughs like the mini-ice age, they normally know of events in the world that could account for it. Solar emissions changes, volcanic eruptions, meteors, etc. I have heard some grumbling about solar emissions, but the report mentions that those variations can not account for the magnitude of the change.
Wow. I just had the most serious case of reliving something in a dream that I have had. I had to get up and walk around it freaked me out so much. I had a dream a long time ago with me typing into a little text box about global warming and mentioning the mini-ice age. Ha, now I am not sure that I remember the dream at all... or do I? Thats the problem with Deja Vu/weird dreams that you might or might not have had. How do you know that you had them? I need to start writing down ones like that, and then making it so I can search them.
Ok, so I got suckered in. I'll be reading the first chapter until I get bored.
The report that I talk about in this post is "Surface Temperature Reconstructions for the Last 2,000 Years (2006)" by the Board on Atmospheric Sciences and Climate.

No comments:
Post a Comment